Understanding the Market Landscape
The performance intelligence market includes several established players, each with different strengths and focus areas. These are proven solutions used by elite clubs worldwide. Each serves a specific purpose within the performance ecosystem.
| Company | Primary Focus | Approach |
|---|---|---|
| Zone7 | AI-powered load analytics | Workload pattern analysis from 2D tracking data |
| Catapult | GPS/wearable tracking hardware | Comprehensive volume and positioning metrics |
| Kitman Labs | Data integration platform | Aggregates data from multiple sources |
| STATSports | GPS performance tracking | Real-time load and positioning data |
| Sparta Science | Force plate assessment | Detailed biomechanical snapshots |
| KINEXON | Real-time positioning (LPS/GPS) | High-precision location tracking |
Where PlayerGuard Fits
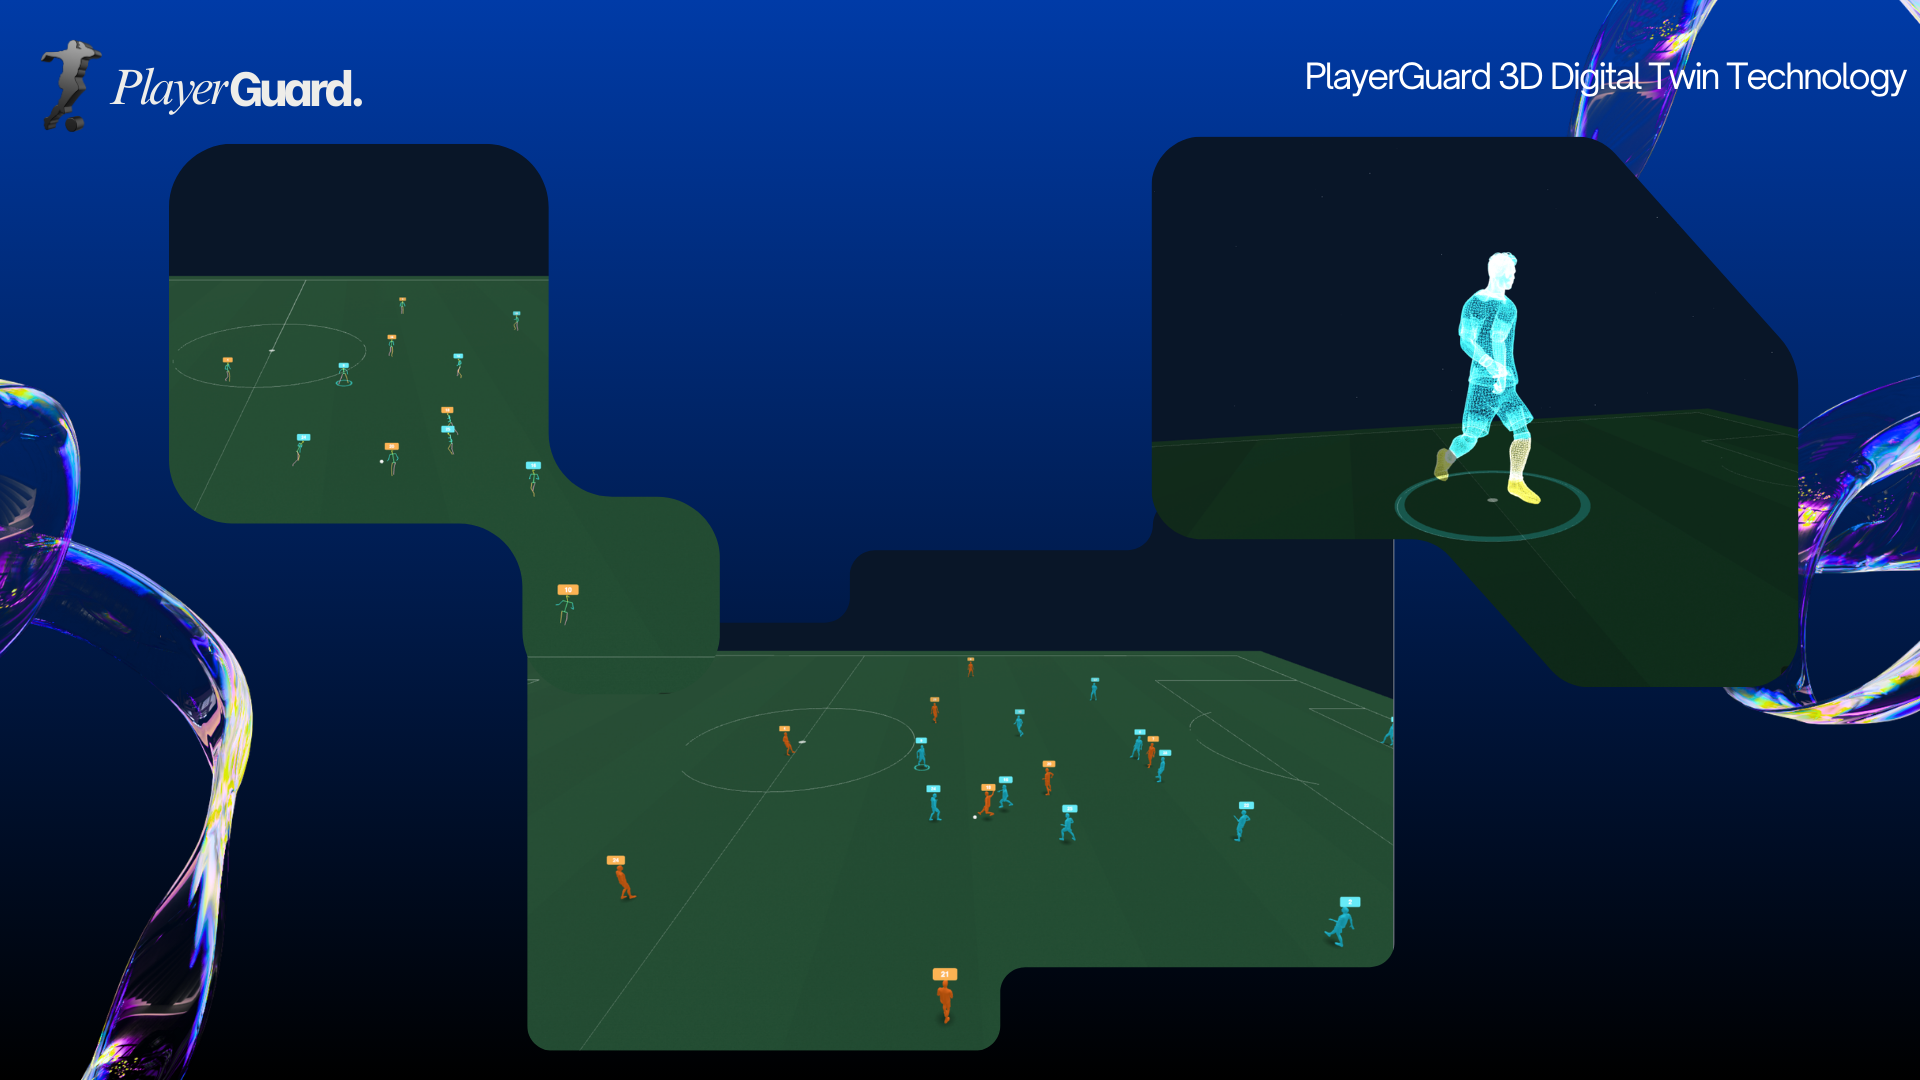
PlayerGuard is designed to complement — not replace — existing tracking infrastructure. Our focus is on extracting biomechanical intelligence from 3D skeletal data, adding a layer of analysis that pure GPS/positioning systems weren't built to provide.
| Capability | What It Means |
|---|---|
| 3D Movement Analysis | Processing skeletal tracking data (21 body points) to quantify movement quality |
| Vertical Load Tracking | Measuring the Z-axis forces that 2D systems cannot capture |
| Landing Asymmetry Detection | Identifying left-right load imbalances during high-intensity movements |
| Continuous Monitoring | Match and session-level analysis, not single-point assessments |
| Individual Baseline Learning | Each player compared to their own historical patterns |
| Natural Language AI Interface | Query biomechanical data in plain language |
| Readiness Scoring | Synthesized output (0-10) combining multiple load factors |
The 2D vs. 3D Distinction
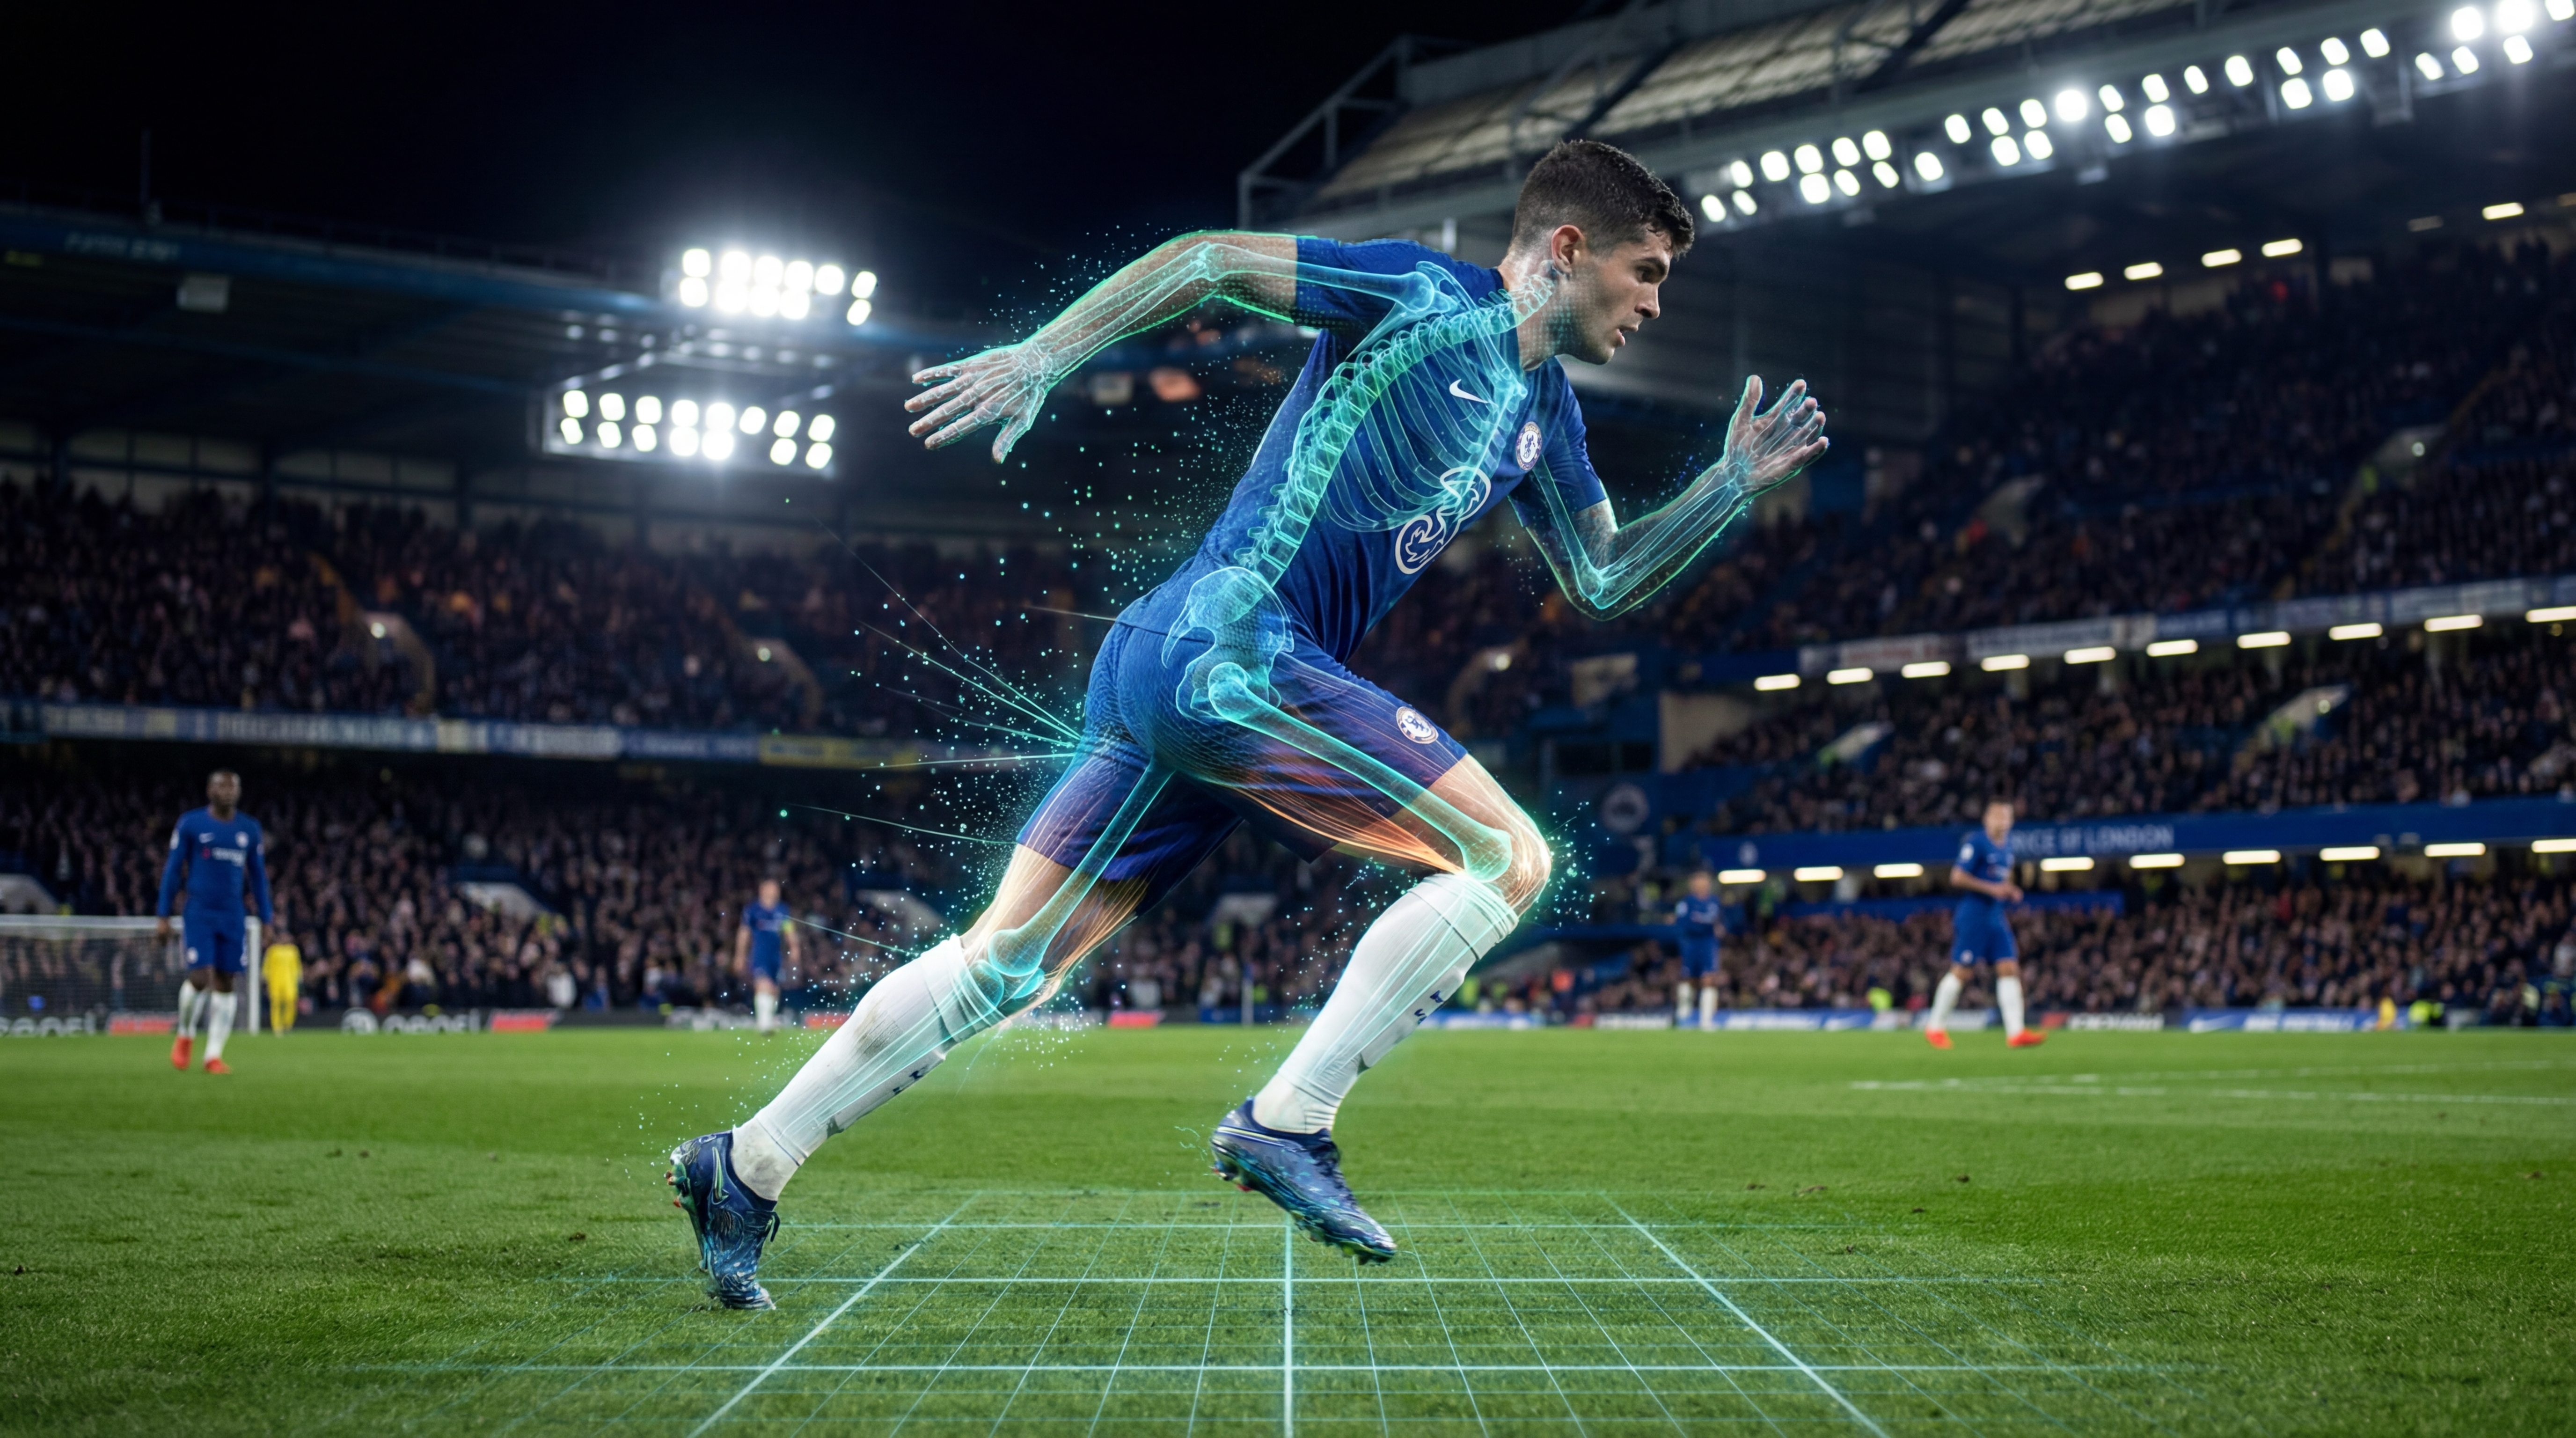
The fundamental difference lies in dimensionality. Traditional GPS and positioning systems capture X and Y coordinates — horizontal movement across the pitch. This enables valuable metrics: distance covered, sprint counts, high-speed running exposure, positioning patterns. But horizontal tracking misses the vertical plane — where gravity exerts force on the body during jumps, landings, decelerations, and direction changes.
What 3D tracking adds:
• Vertical impact forces — Jump frequency, landing load, aerial duel stress
• Deceleration mechanics — How efficiently players brake and change direction
• Movement asymmetry — Left-right imbalances in ground contact and load distribution
• Postural efficiency — Trunk lean, hip drop, and mechanical compensations
These dimensions provide insight into how well a player is moving, not just how much.
Practical Comparison: Volume vs. Quality
The most complete picture comes from combining both — using GPS for volume metrics and 3D analysis for quality metrics.
| Metric Type | 2D Tracking (GPS) | 3D Biomechanical Analysis |
|---|---|---|
| Distance | Total meters covered | — |
| Speed | Peak velocity, speed zones | — |
| Acceleration | Horizontal acceleration counts | — |
| Vertical Load | — | Jump height, landing impact |
| Deceleration Quality | Count of decel events | Force distribution, braking vectors |
| Asymmetry | — | Left-right load imbalance |
| Movement Efficiency | — | Postural mechanics, trunk stability |
PlayerGuard's Differentiators
1. Purpose-Built for 3D Data: PlayerGuard was designed from the ground up to process skeletal tracking data. We're not retrofitting 2D algorithms; our biomechanical engine is native to three-dimensional analysis.
2. Movement Quality Focus: While most systems answer 'how much load?', we answer 'how is the player handling the load?' This distinction matters for informed rotation and training decisions.
3. Natural Language Interface: Performance staff can query the system directly: 'Why is this player's readiness score lower than last week?' or 'Who has the highest vertical load accumulation this month?' No data science expertise required.
4. Contextual Explanations: Every Readiness Score includes the specific biomechanical factors driving it. Staff see why a player is flagged, not just that they are.
5. Hardware Agnostic: PlayerGuard integrates with existing tracking infrastructure. If your club already uses Catapult, STATSports, or KINEXON for GPS data, we layer on top — adding biomechanical depth without requiring new hardware.
When to Use What
Different tools serve different purposes. Here's how we see the ecosystem. PlayerGuard is strongest when clubs want to understand the quality of movement, not just the quantity — and want that analysis continuously, not as periodic snapshots.
| Need | Best Tool(s) |
|---|---|
| Real-time positioning during matches | KINEXON, Catapult, ChyronHego |
| Training load volume tracking | Catapult, STATSports, GPS providers |
| Workload pattern analysis | Zone7, Kitman Labs |
| Point-in-time biomechanical assessment | Sparta Science, force plates |
| Continuous 3D movement quality analysis | PlayerGuard |
| Data aggregation and integration | Kitman Labs, club data platforms |
Conclusion
The performance intelligence landscape includes many capable solutions, each with strengths in specific areas. PlayerGuard's contribution is adding the third dimension — vertical load, movement asymmetry, and biomechanical efficiency — to the existing ecosystem of load monitoring tools. We believe the most effective performance operations will combine volume tracking (GPS) with quality analysis (3D biomechanics) for a complete picture. PlayerGuard is built to provide that biomechanical layer, integrating with existing infrastructure rather than replacing it.
References
- Buchheit M, Simpson BM. (2017). Player tracking technology: half-full or half-empty glass?. International Journal of Sports Physiology and Performance.
- Akenhead R, Nassis GP. (2016). Training load and player monitoring in high-level football. British Journal of Sports Medicine.
- Bourdon PC, et al. (2017). Monitoring athlete training loads: consensus statement. International Journal of Sports Physiology and Performance.