What Is the 3D Digital Twin?
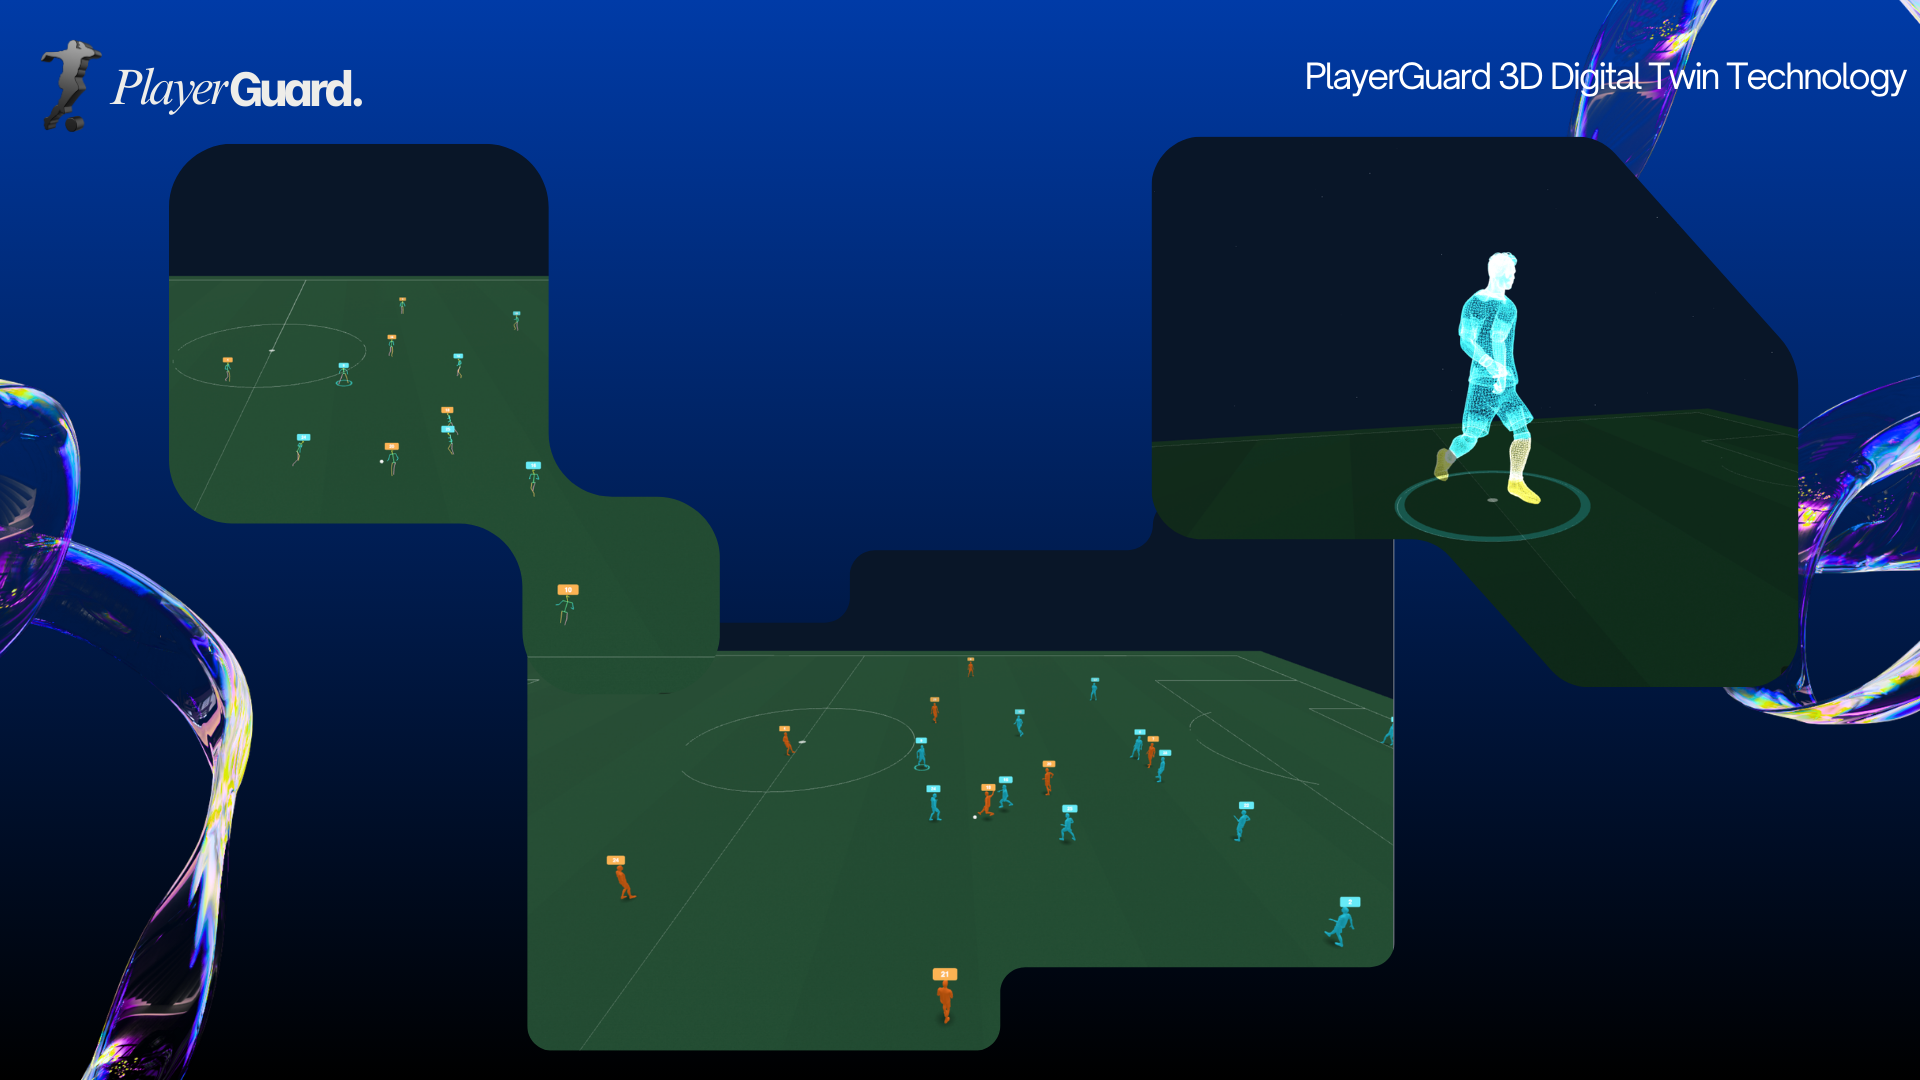
A digital twin is a real-time virtual representation of a physical entity. In PlayerGuard's context, it means every player on the pitch is rendered as a fully articulated 3D character — driven by live positional and skeletal tracking data at 25 frames per second.
The system processes 21 anatomical keypoints per player, mapping real-world body positions to a virtual skeleton in real time. This isn't pre-recorded animation — it's live motion capture rendered directly in the browser, accessible from any device without specialized hardware.
The result is a complete biomechanical overview of your entire squad, visualized as an interactive 3D scene. Coaches can orbit around individual players, zoom into specific body regions, and observe movement patterns that would be invisible from a traditional camera angle.
Multiple Visualization Modes for Every Use Case
Different stakeholders need different levels of detail. A head coach reviewing squad readiness before a match needs a different view than a biomechanist analyzing landing asymmetry in a specific player. PlayerGuard addresses this with three distinct rendering modes, each designed for a specific analytical purpose.
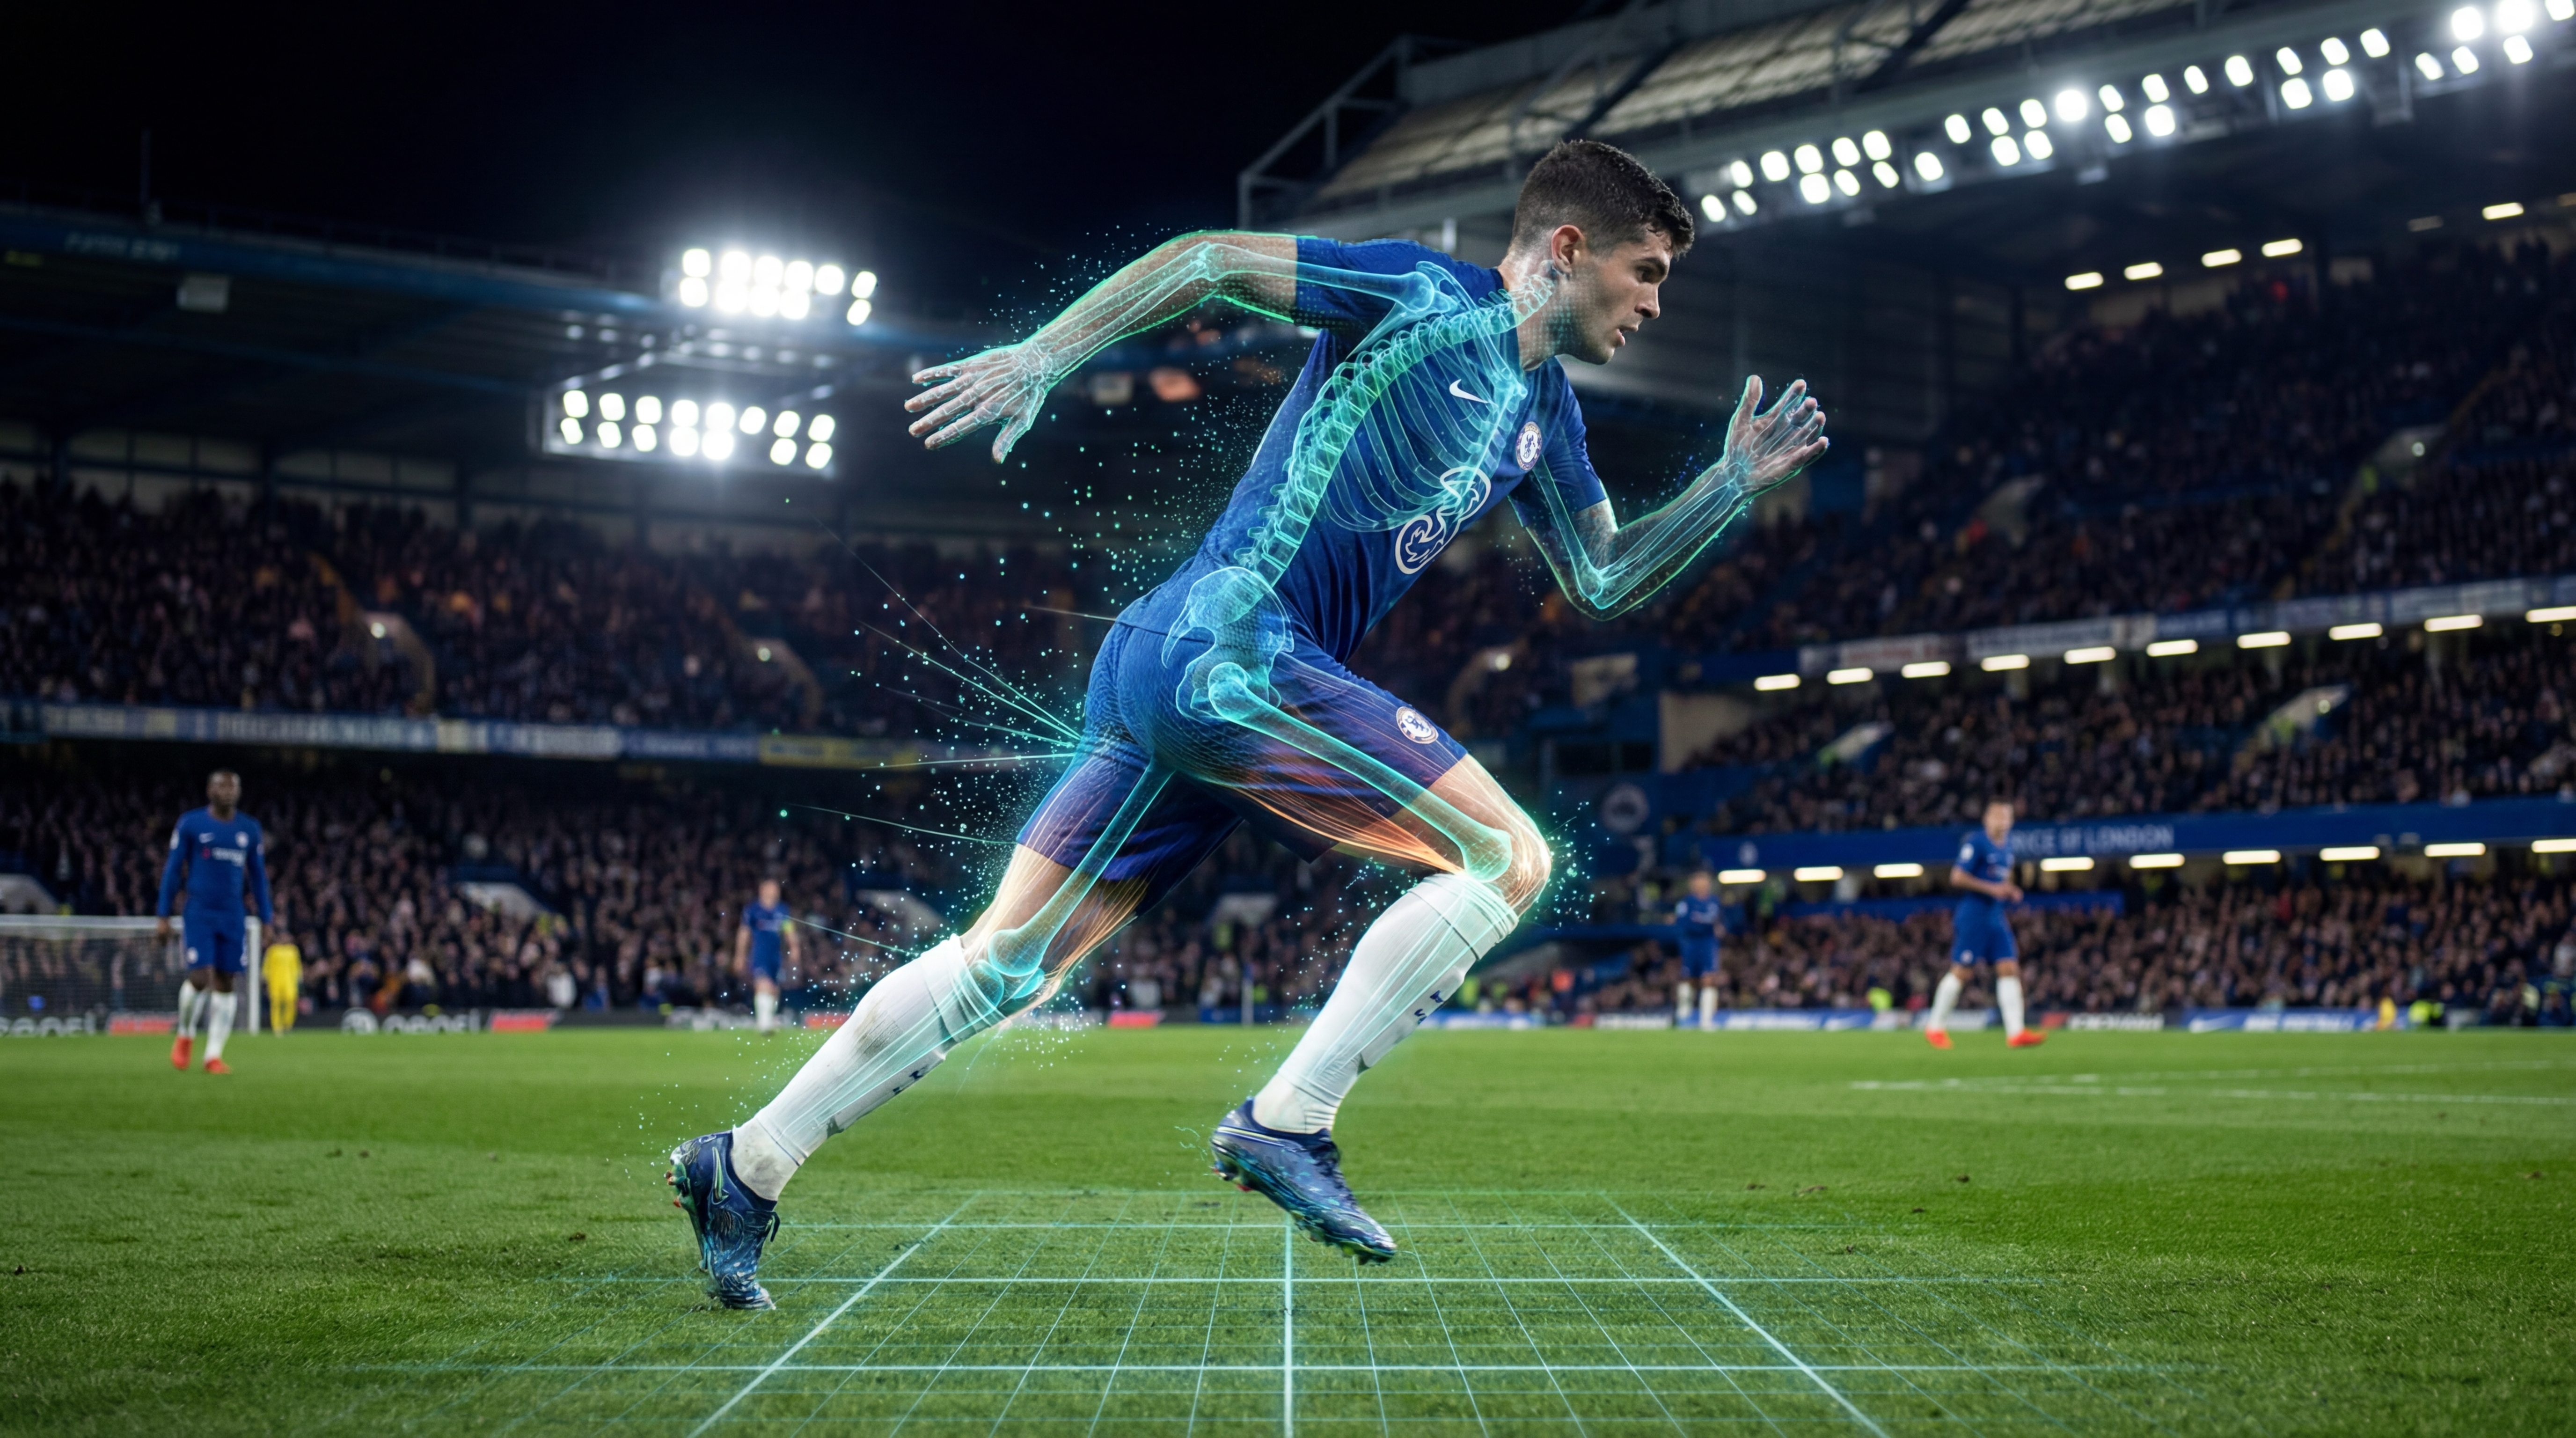
Skeleton View strips the visualization down to pure biomechanics — bones, joints, and movement vectors. This mode is built for sports scientists and physiotherapists who need to see exactly how forces are distributed through the kinetic chain. Joint angles, limb velocities, and movement asymmetries are immediately visible. It's the X-ray view of player performance.
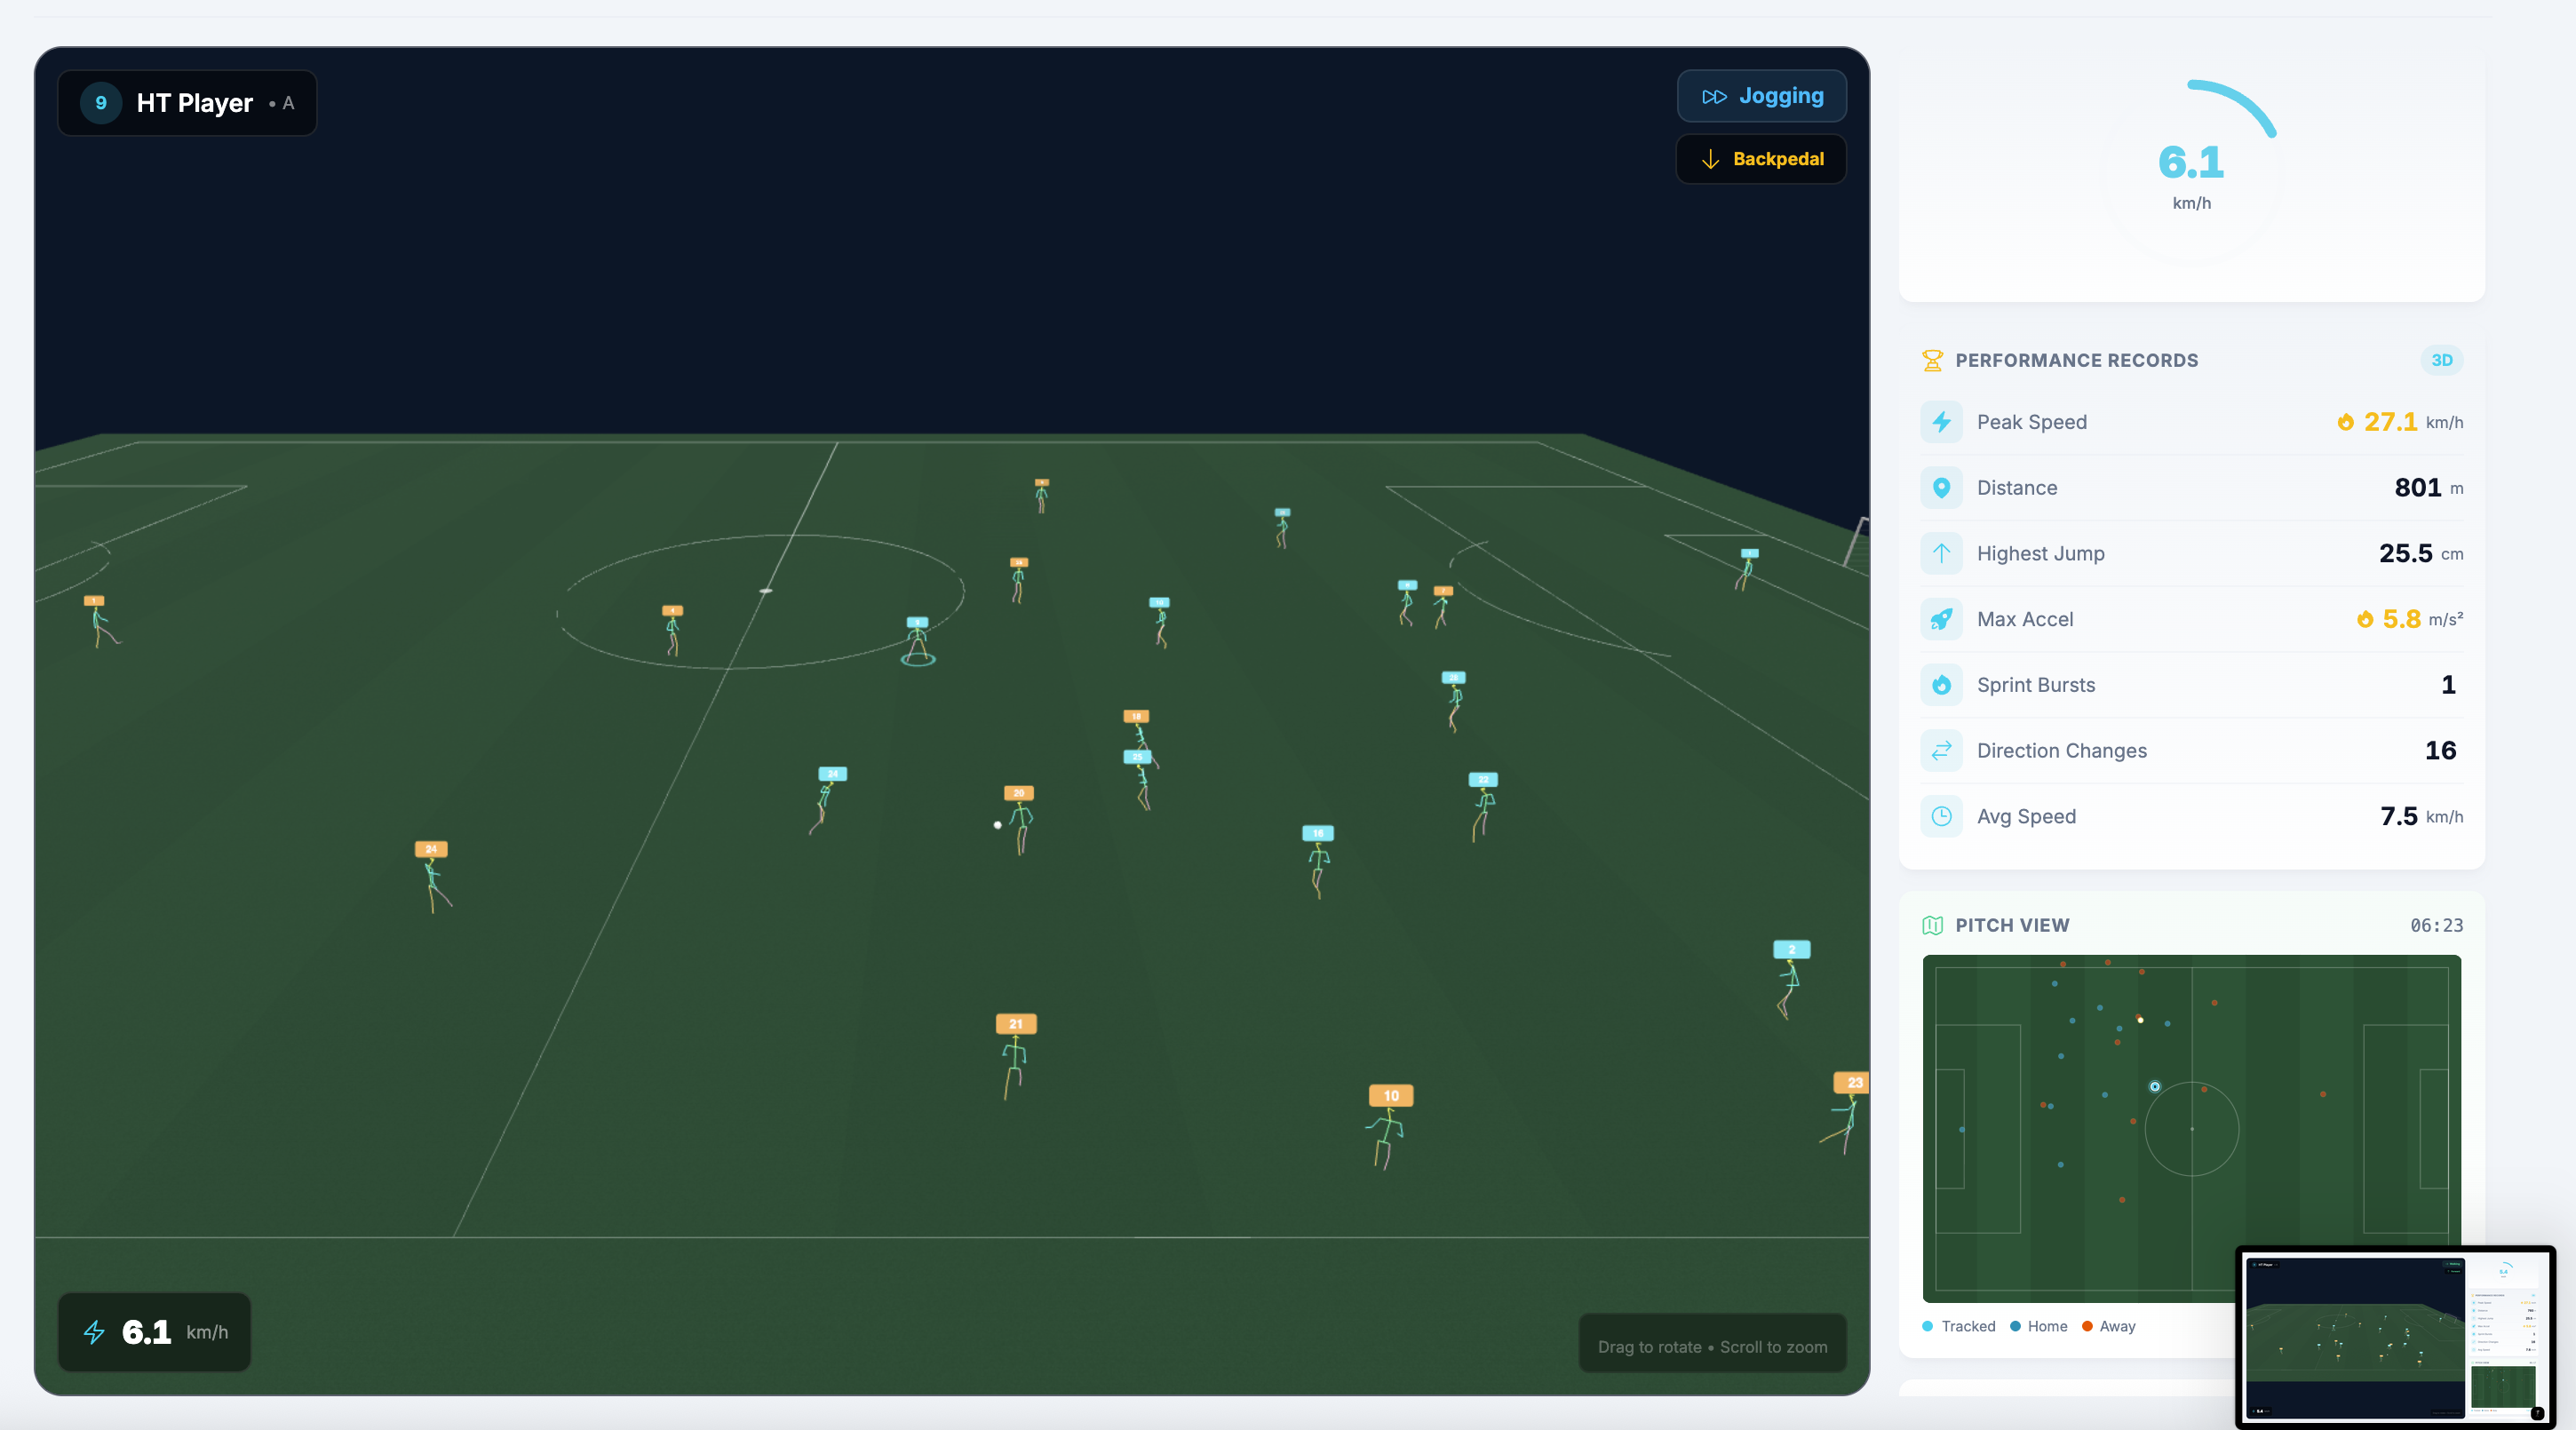
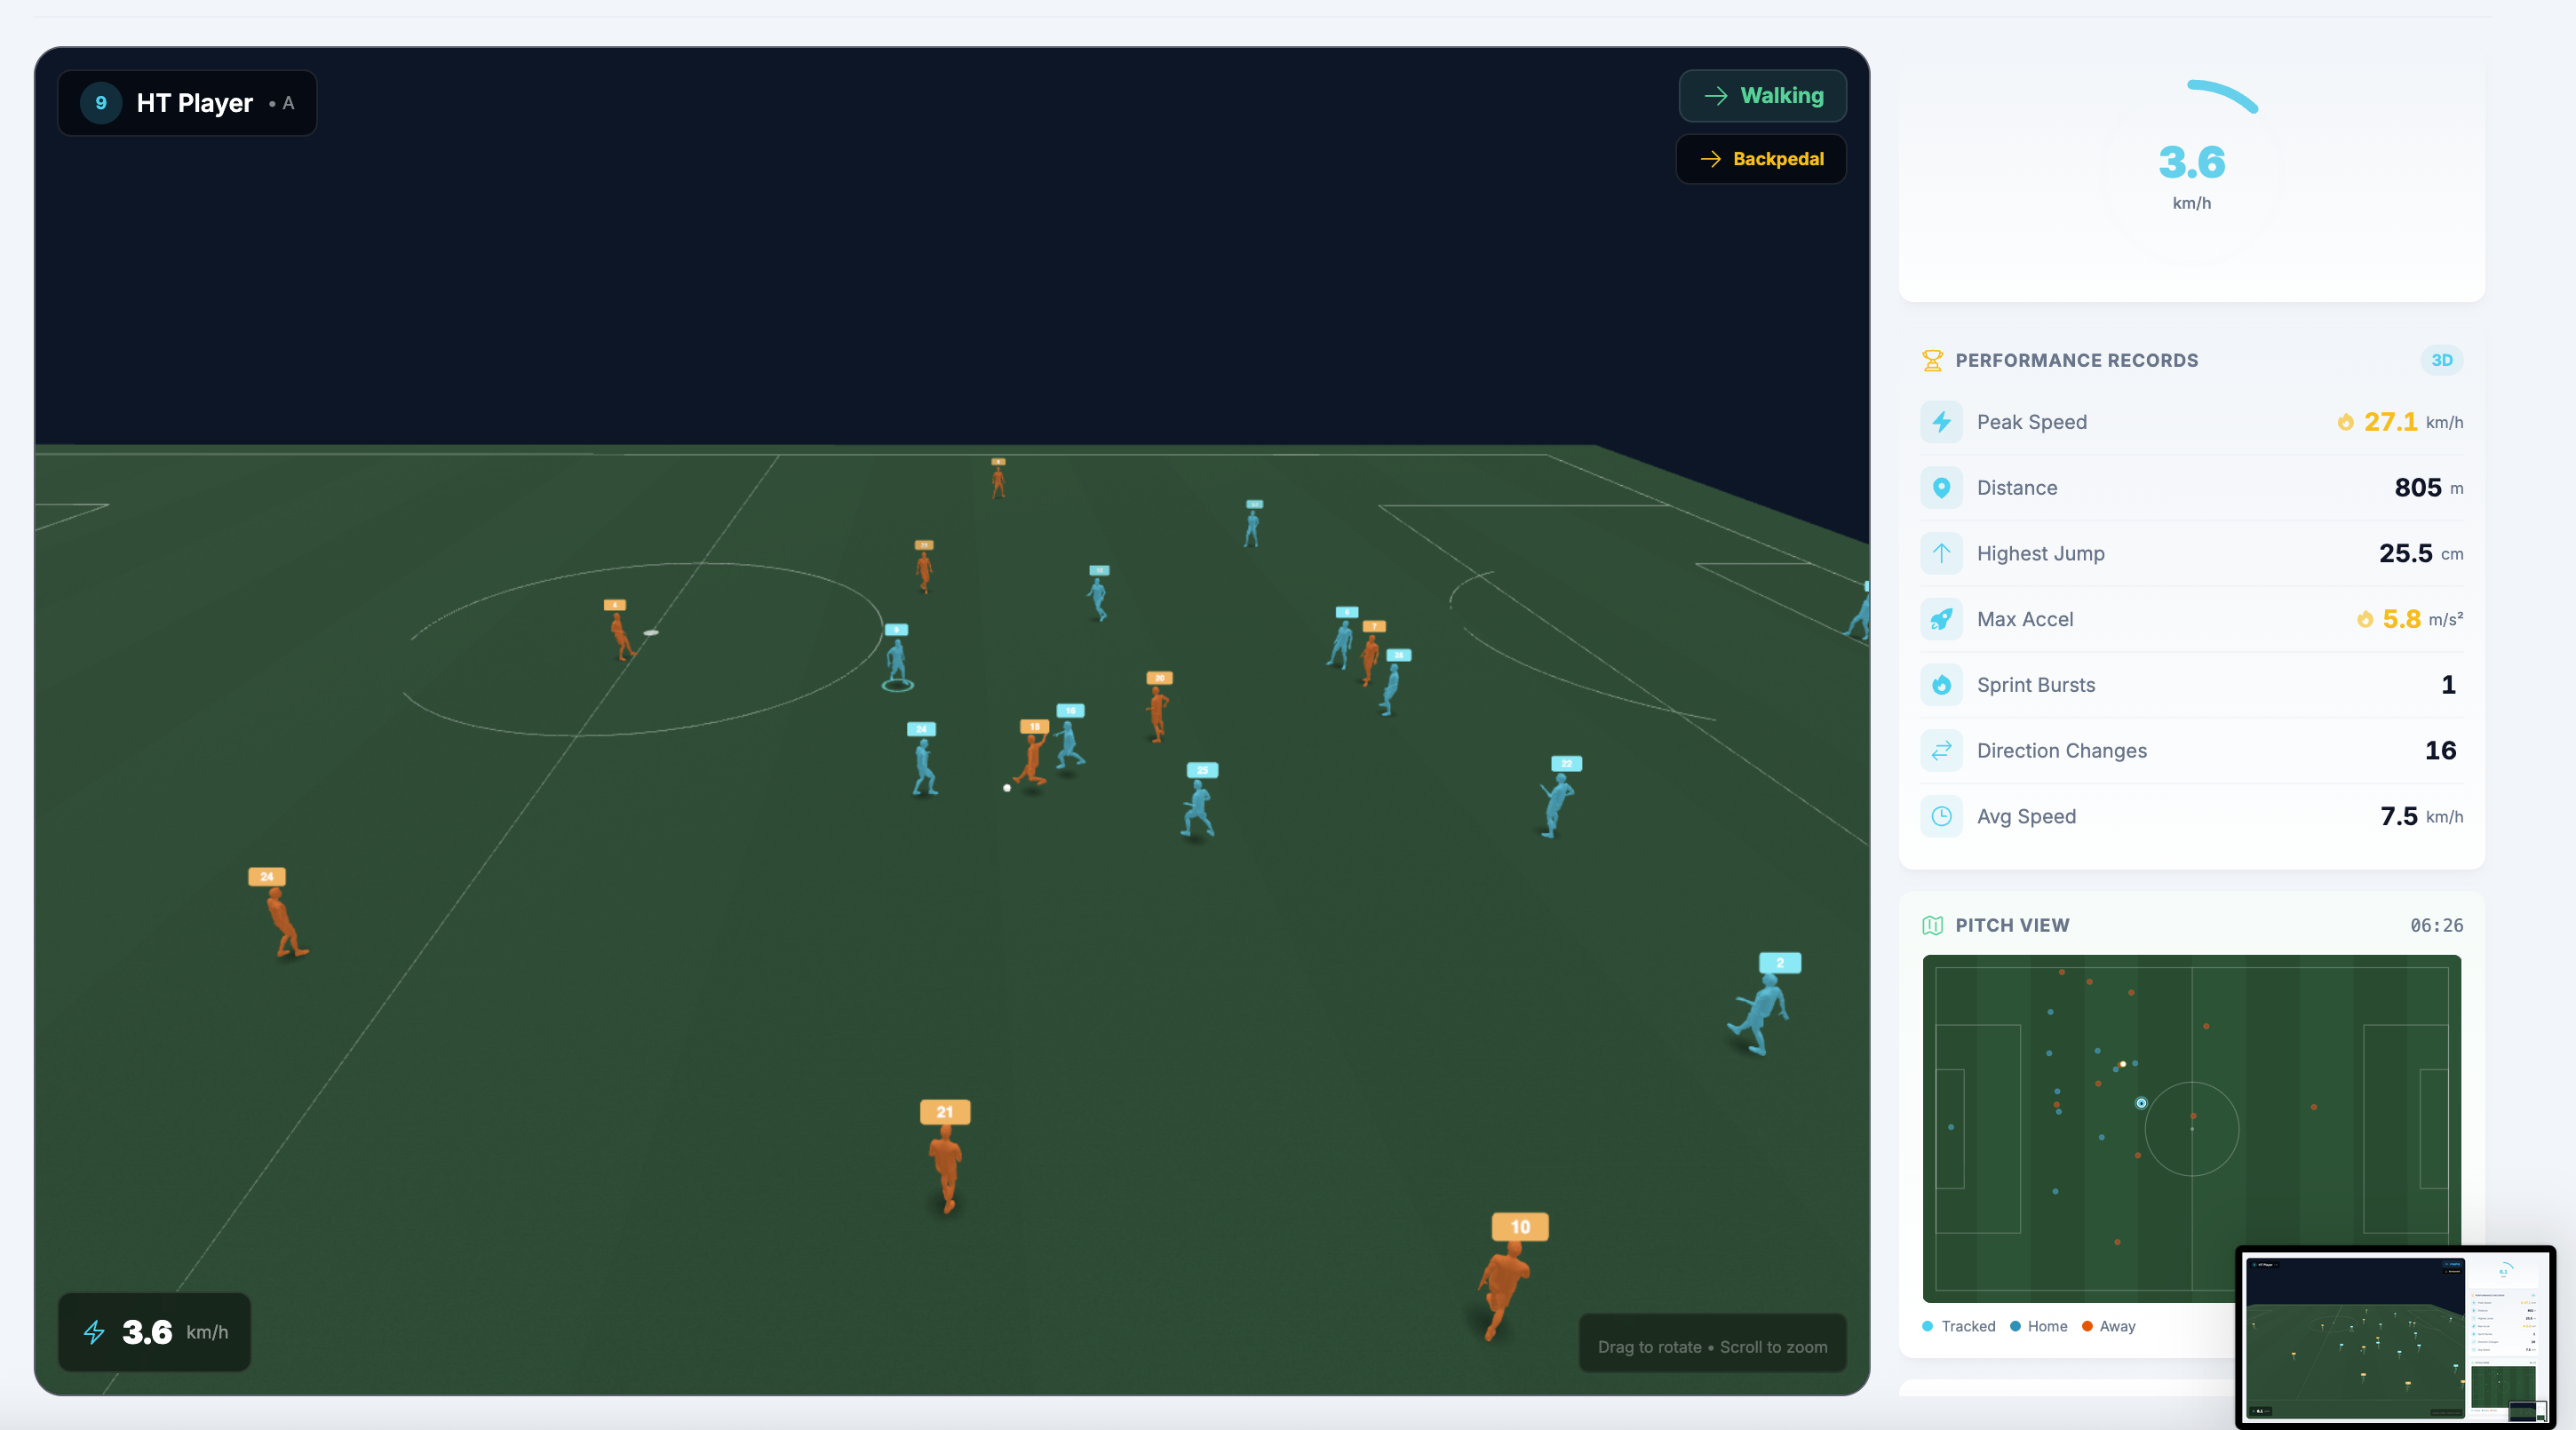
Character View renders fully textured 3D player models driven by live skeletal data. Team colors, jersey numbers, and realistic proportions make it easy to identify players at a glance. This mode is ideal for coaching staff reviewing tactical movement patterns, body positioning during set pieces, or comparing movement quality between players in the same position.
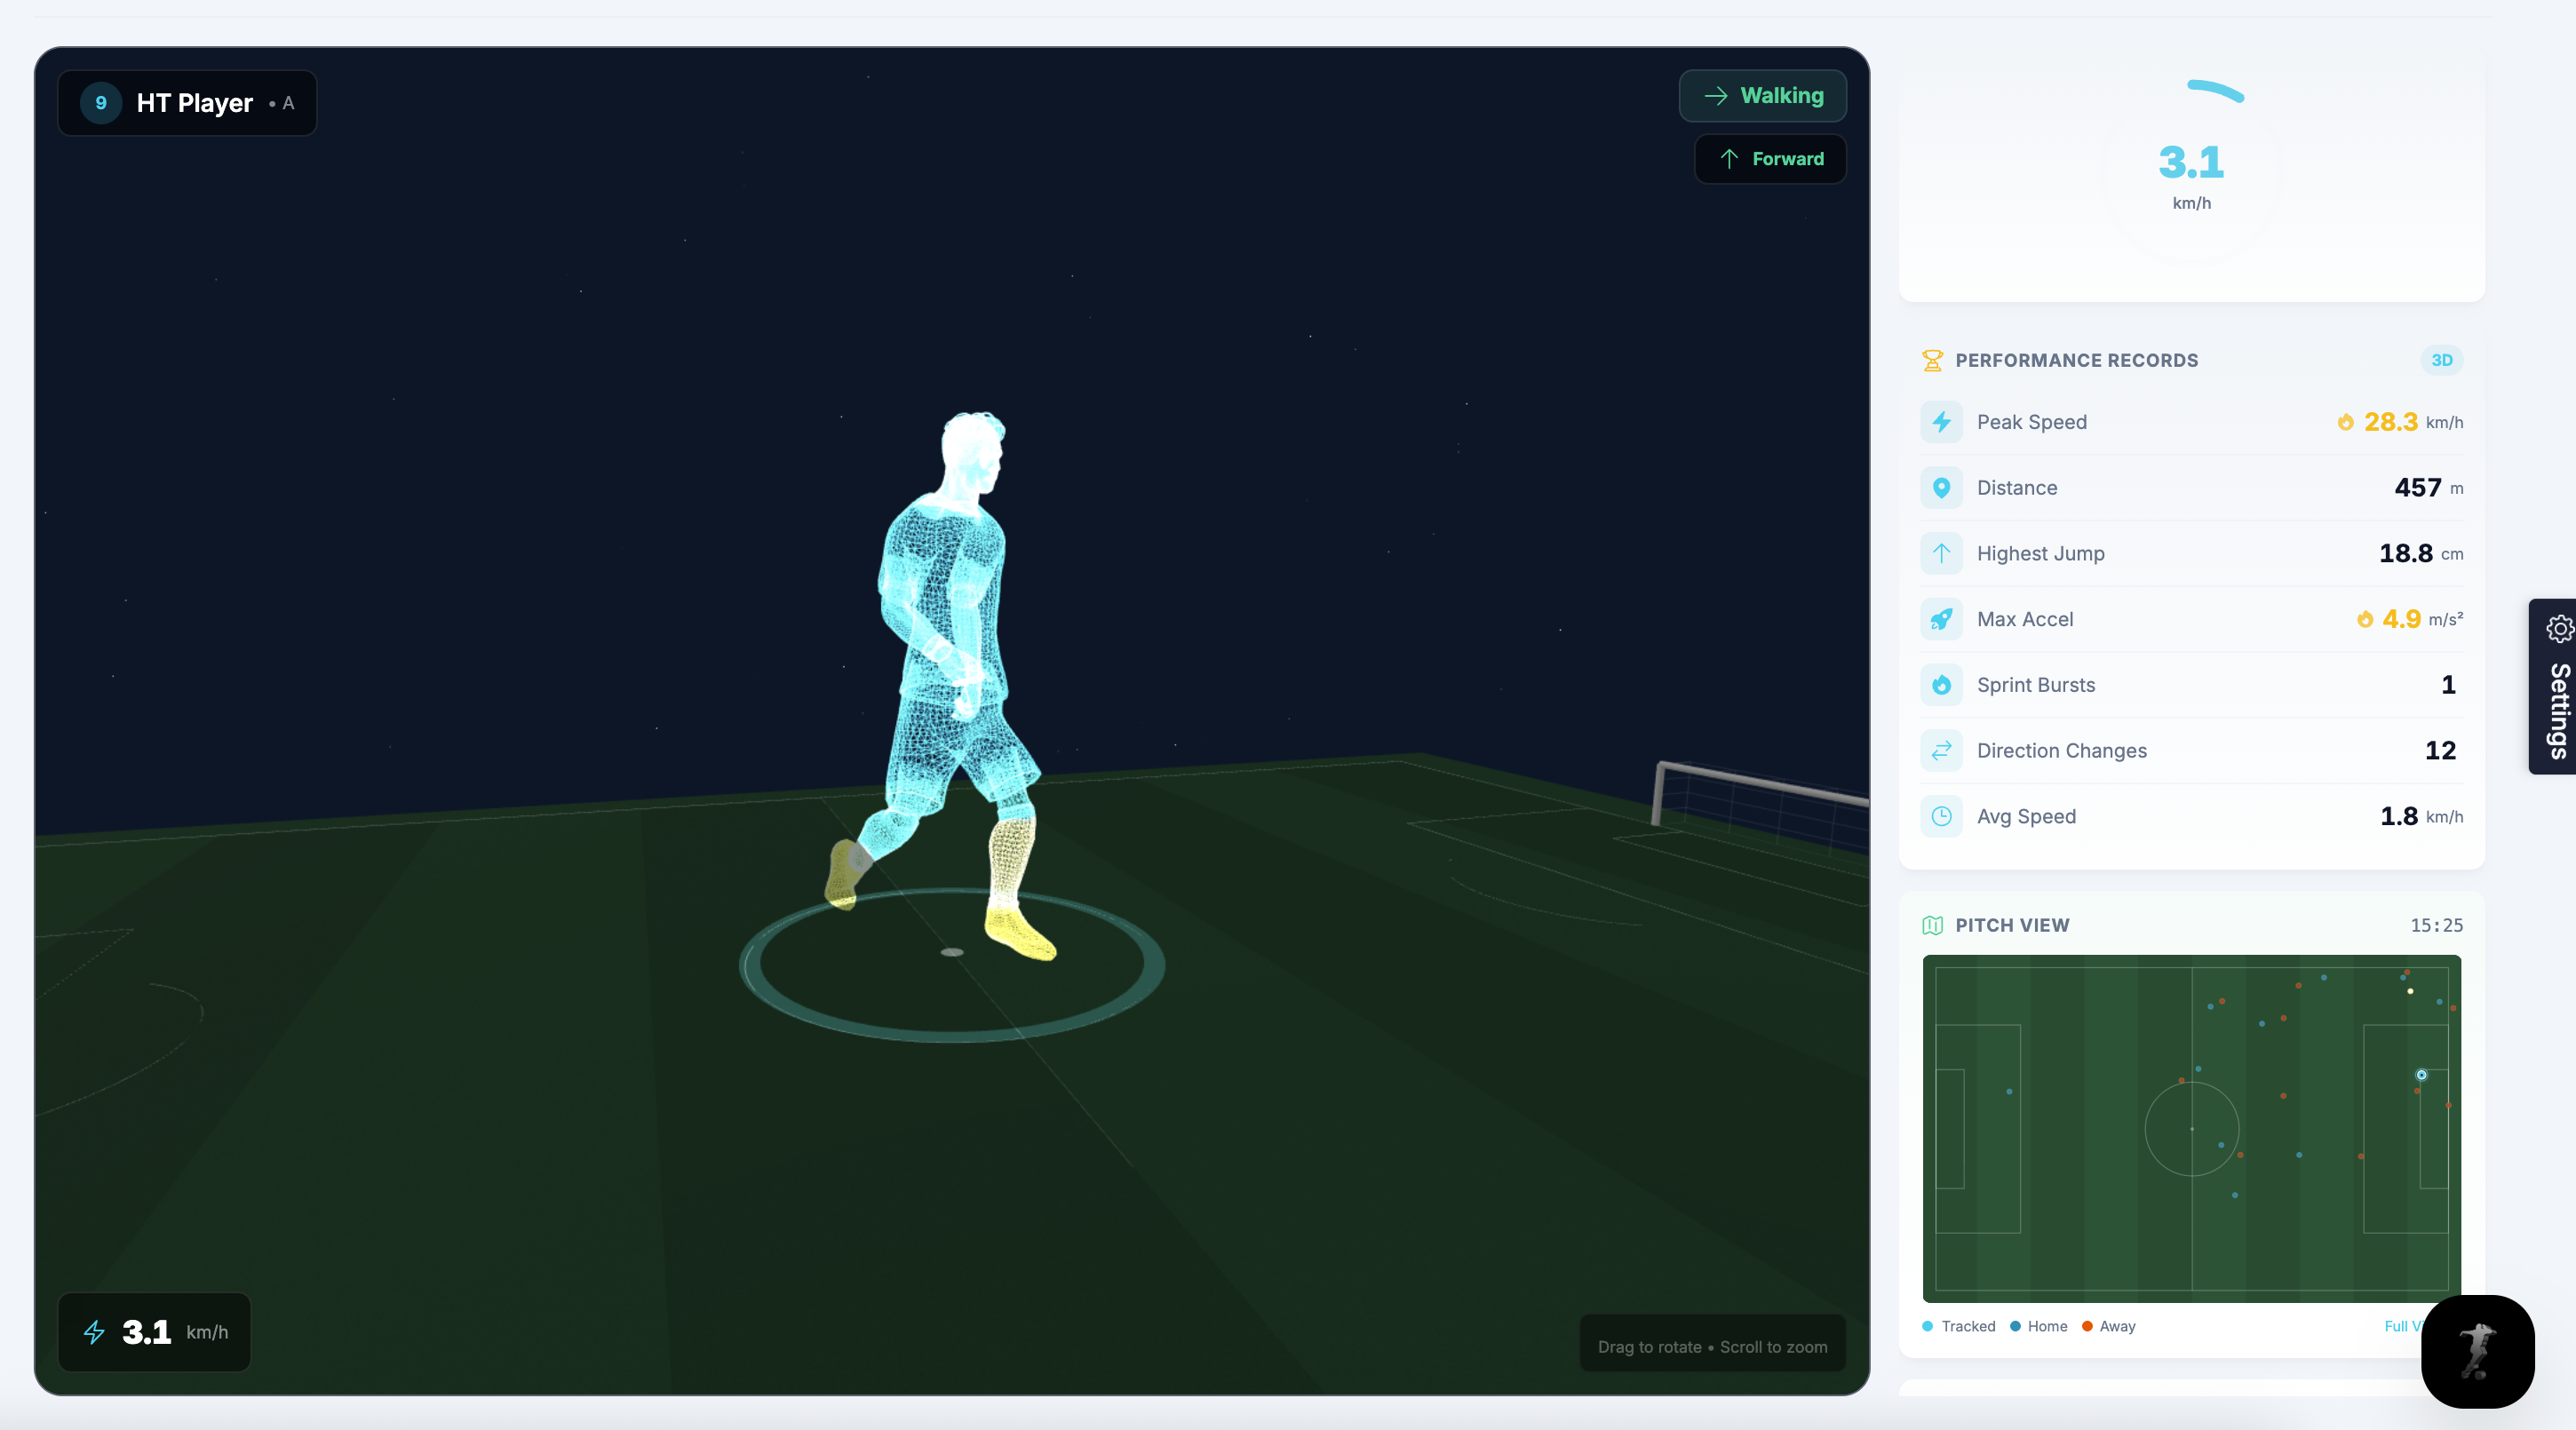
Digital Twin View combines the anatomical detail of the skeleton with color-coded muscle stress zones overlaid on the character model. Body regions are shaded from green (low stress) through yellow to red (high stress) based on real-time vertical load calculations. This is the mode that performance teams use for live monitoring — instantly seeing which players are accumulating mechanical stress and where in the body it's concentrating.
Skeleton View — The Biomechanist's Lens
The skeleton visualization mode renders each player as a connected bone structure — 21 tracked keypoints linked by limb segments, with per-limb coloring that encodes movement intensity or load zone.
This stripped-down view removes visual noise and focuses entirely on the mechanics of movement. Sports scientists can observe stride symmetry, hip drop during single-leg stance, trunk rotation during sprints, and deceleration patterns — all in real time.
Each limb segment can be independently colored based on the load metric of choice: vertical ground reaction force, angular velocity, or cumulative stress. This makes it possible to spot asymmetry at a glance — for example, a player consistently loading their left leg 15% more than their right during high-speed decelerations.
Character View — The Coach's Perspective
Character mode renders fully realized 3D player models with team-colored materials and jersey identification. The models are driven by the same live skeletal data, but wrapped in a visual presentation that coaches and non-technical staff find intuitive.
In this mode, coaches can observe body language and posture in a way that traditional broadcast cameras can't provide. Is a player's running posture deteriorating in the 75th minute? Are deceleration mechanics changing compared to the first half? Is a player favoring one side during direction changes?
The camera system supports multiple modes: orbit (free rotation around a single player), follow (tracking a specific player across the pitch), and bird's-eye (tactical overview of the full squad). Each mode serves a different analytical purpose — from individual biomechanical inspection to squad-wide tactical review.
Digital Twin View — Real-Time Muscle Stress Mapping
The digital twin visualization mode is where PlayerGuard's biomechanical engine is most visibly powerful. Each player model is overlaid with color-coded body zones that reflect real-time mechanical stress calculations.
Ten distinct body zones are independently monitored: head, shoulders, torso, hips, left and right thighs, left and right shins, and left and right feet. Each zone's color intensity is derived from the underlying vertical load model — which calculates ground reaction forces, impact accumulation, and asymmetry indices from the 3D skeletal data.
Performance staff can immediately see, for example, that a striker's right quadriceps zone has been trending toward amber over the last 20 minutes — indicating accumulating eccentric load from repeated high-speed decelerations. This kind of insight was previously only available through post-session analysis with force plates or wearable sensors. Now it's visible in real time, during the match.
Connected to PlayerGuard AI Agent
The 3D Digital Twin isn't a standalone visualization — it's directly integrated with PlayerGuard's AI Agent, creating a conversational interface for biomechanical intelligence.
Coaches and performance staff can interact with the AI Agent through natural language queries while viewing the 3D scene. Ask 'Which players have the highest vertical load accumulation this half?' and the agent responds with ranked data while simultaneously highlighting those players in the 3D view. Ask 'Show me the load comparison for Player 10 versus last week' and the agent pulls historical data, generates comparisons, and can trigger visualization changes — all from the chat interface.
The AI Agent can also trigger actions directly: adjusting readiness scores, flagging players for review, generating load reports, or sending alerts to medical staff. This tight integration between visualization and intelligence means that insights discovered in the 3D view can be acted on immediately — without switching tools, opening spreadsheets, or waiting for post-match analysis.
This is the paradigm shift: the digital twin becomes not just a window into biomechanical data, but an interactive command center for performance decisions.
Use Cases: From Performance Lab to Broadcast Studio
The versatility of PlayerGuard's visualization modes opens applications far beyond the traditional performance department:
• Match-Day Performance Monitoring — Performance staff use the digital twin view during matches to monitor real-time load accumulation across the squad, informing substitution timing and tactical adjustments.
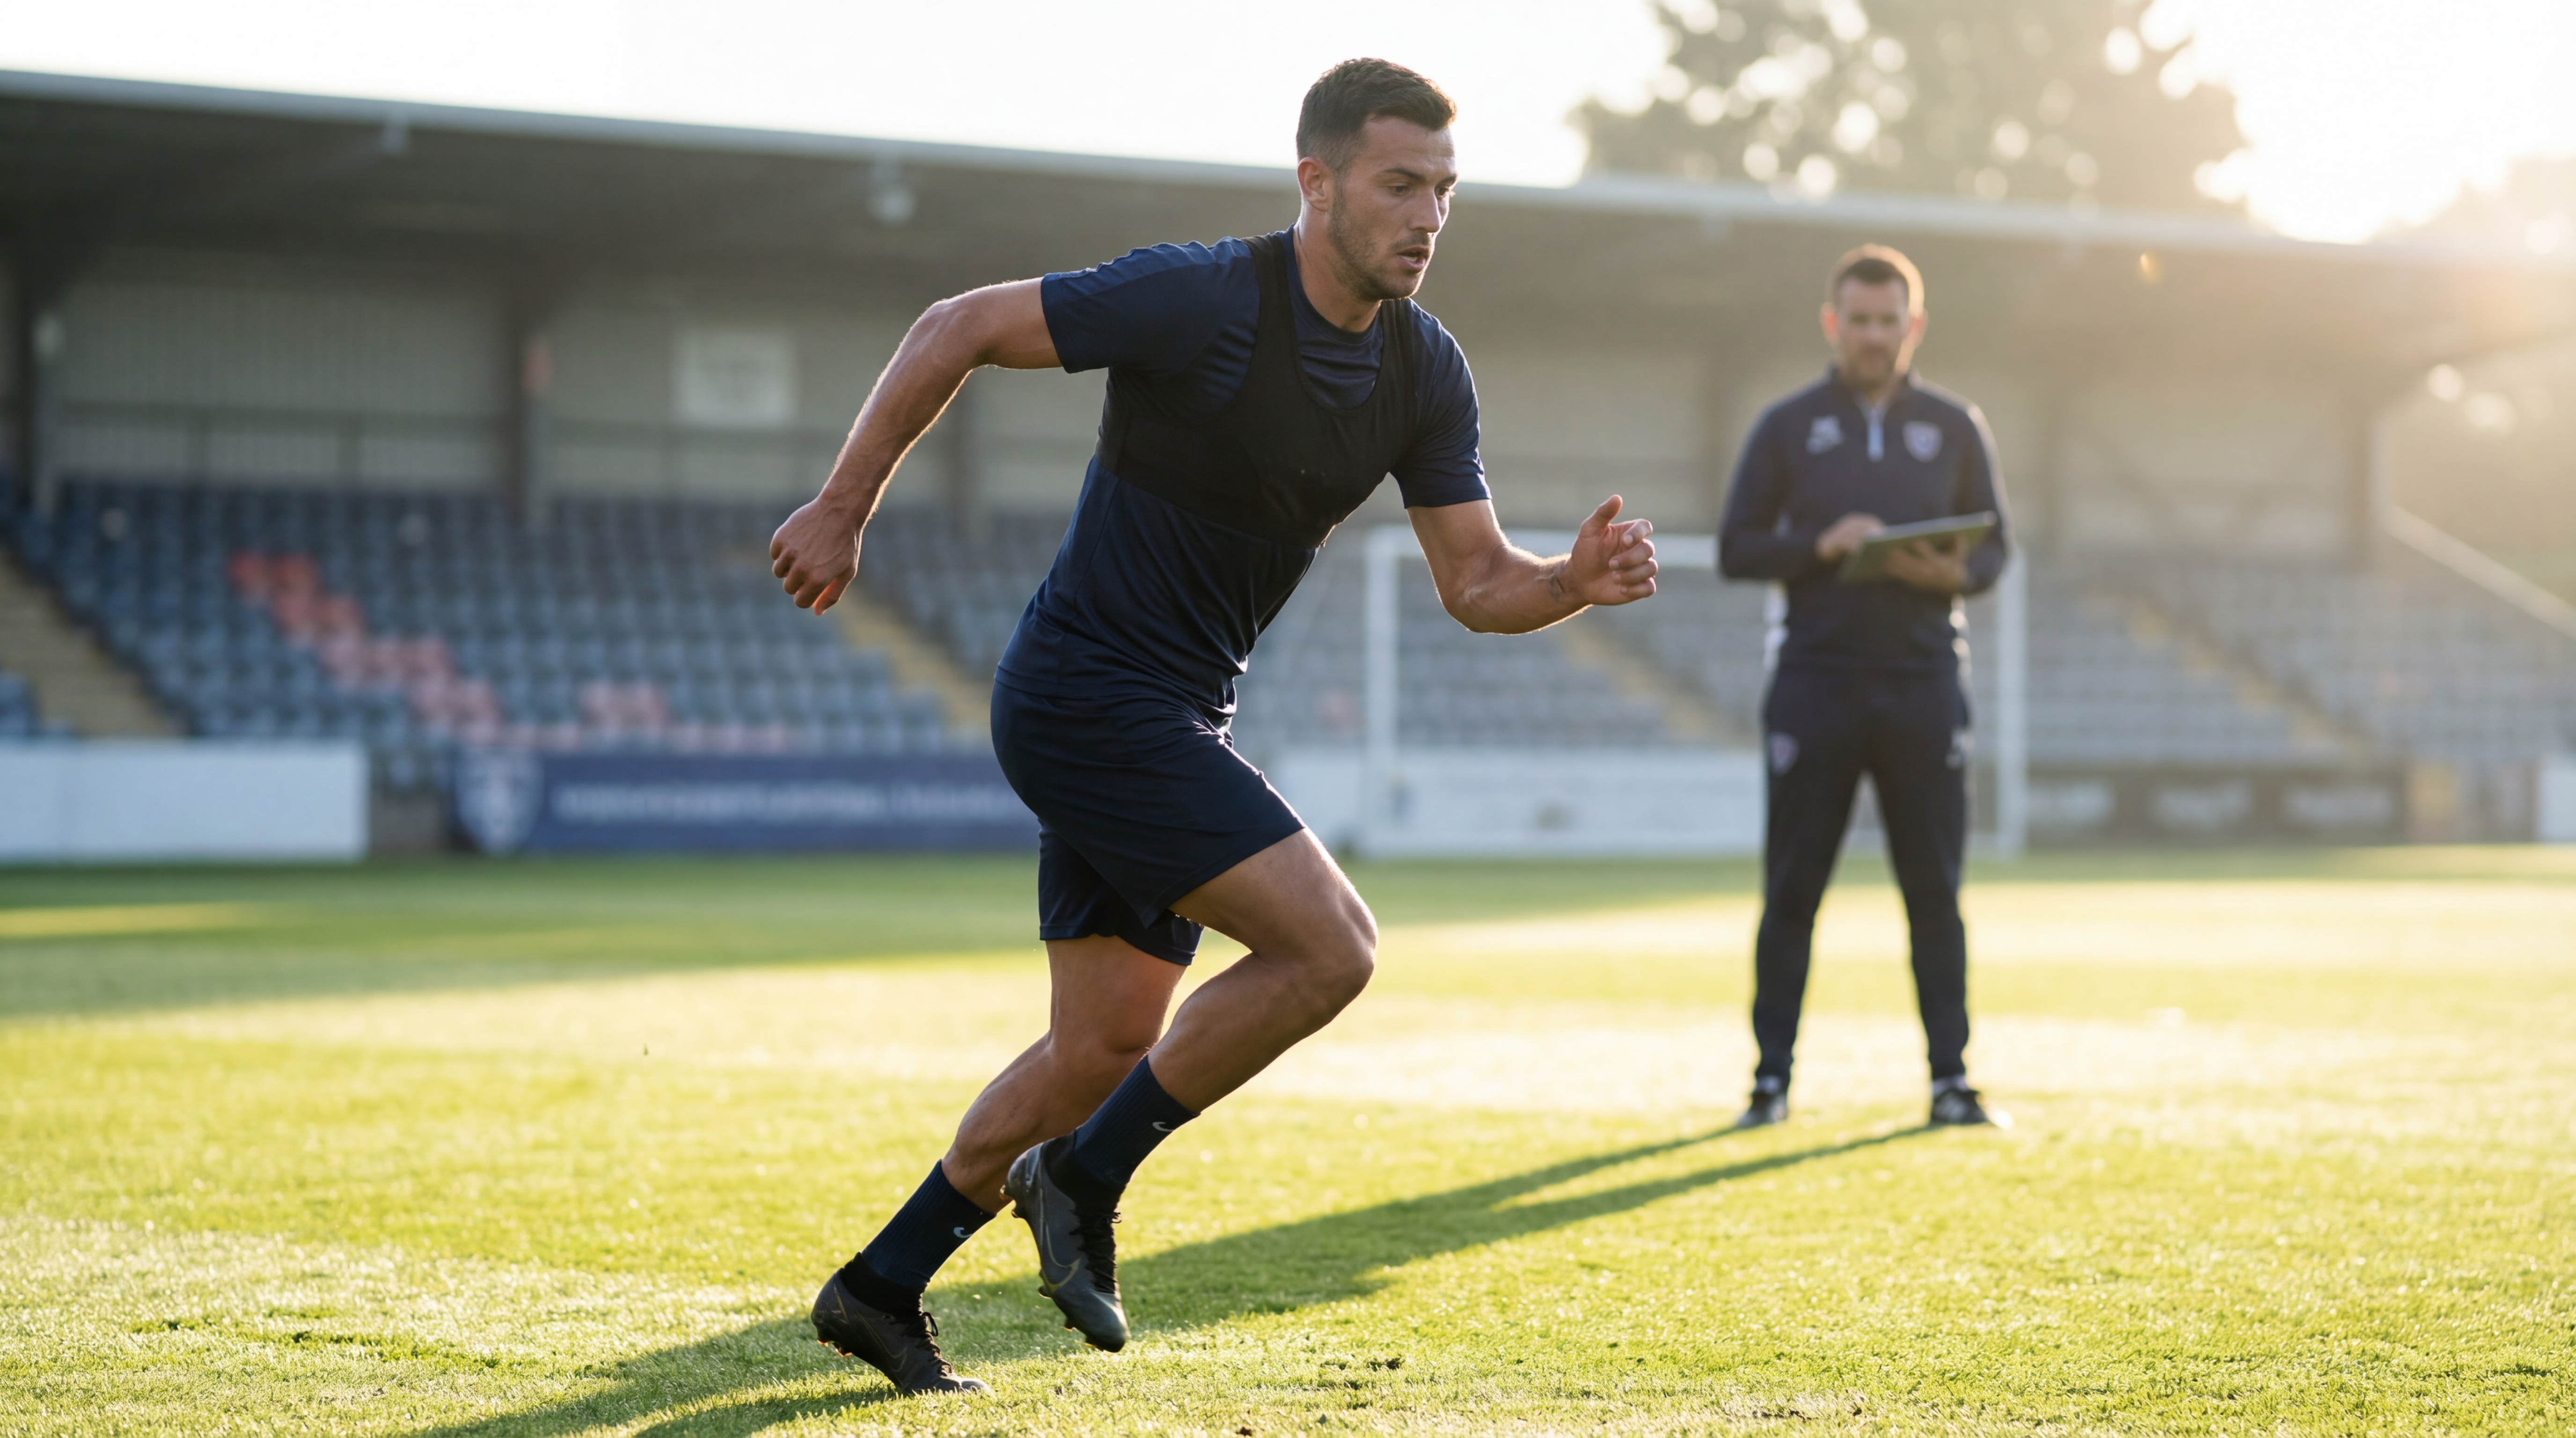
• Training Session Analysis — Skeleton view provides granular biomechanical feedback during training, helping coaches identify movement compensations or fatigue-related changes in real time rather than waiting for post-session review.
• Rehabilitation Tracking — The ability to compare a returning player's movement patterns against their pre-injury baseline provides objective metrics for return-to-play decisions.
• Media and Broadcasting — Character view with team colors and jersey identification creates compelling visual content for broadcast augmentation. Imagine match commentary enhanced with real-time 3D replays showing exactly how a player's body moved during a critical tackle or sprint — from any angle, rendered in real time.
• Fan Engagement — The same 3D technology can power interactive fan experiences: letting viewers explore player movement from any perspective, zoom into key moments, and understand the biomechanical demands of elite performance.
• Scouting and Recruitment — Biomechanical profiles rendered through the digital twin provide objective movement quality data that complements traditional scouting metrics.
Accessible Anywhere: No Downloads, No Special Hardware
PlayerGuard's 3D Digital Twin runs entirely in the browser. There are no plugins to install, no desktop applications to download, and no specialized hardware required. Open the platform on any modern device and the full biomechanical visualization is immediately available — lightweight, fast, and fully interactive.
The system is engineered to be extremely performant even under demanding real-time conditions. All 22 field players are rendered simultaneously with smooth, fluid animation, real-time body zone updates, and responsive camera controls — all without compromising frame rate or responsiveness.
This means coaches can check live biomechanical data on a laptop in the dugout, physiotherapists can review player load on a tablet in the medical room, and analysts can run full squad reviews on large screens in the performance suite. No infrastructure changes. No IT setup. Just a browser and an internet connection — the entire squad's biomechanical state is live in front of you.
PlayerGuard's technology stack is purpose-built for sports performance: ultra-lightweight, highly optimized for real-time 3D rendering, and designed to scale from individual player inspection to full squad-level monitoring without any performance degradation.
Conclusion
PlayerGuard's 3D Digital Twin technology represents a fundamental shift in how performance teams interact with biomechanical data. By replacing abstract numbers and 2D charts with a living, three-dimensional replica of every player — streaming in real time, viewable from any angle, and connected directly to AI-powered analytics — we're giving coaches and performance staff the tools to make faster, better-informed decisions. The combination of multiple visualization modes (skeleton, character, and digital twin), real-time muscle stress mapping, and conversational AI integration creates a unified platform where seeing, understanding, and acting on biomechanical intelligence happens in a single workflow. This is the future of performance analytics: not more data, but better ways to see it, understand it, and act on it — in real time.
References
- Colyer SL, Evans M, Mayagoitia RE, et al. (2020). Understanding the influence of lower-limb biomechanics on vertical jump performance. Sports Biomechanics.
- Buchheit M, Simpson BM. (2017). Player tracking technology: half-full or half-empty glass?. International Journal of Sports Physiology and Performance.
- Grieves M, Vickers J. (2017). Digital Twin: Mitigating Unpredictable, Undesirable Emergent Behavior in Complex Systems. Transdisciplinary Perspectives on Complex Systems.
- Barris S, Button C. (2008). A review of vision-based motion analysis in sport. Sports Medicine.